Federgraph Tutorial
Info
- This is the user manual for the original version.
- Version 1.0 was created in August 2013.
- Text was shortened in January 2015.
- Technical progress since is considerable.
- So the documentation is in need of a new format.
Screenshot
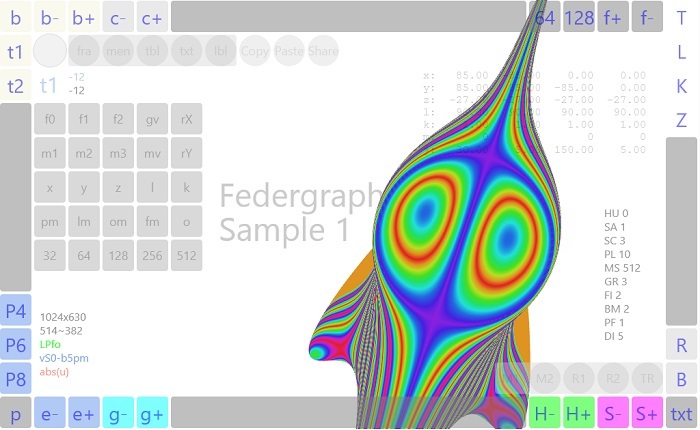
Imagine you sit in front of an oscilloscope and want to view a signal. First of all you need to make sure a decent signal is coming in from outside, then you would probably manipulate some rotary switches and knobs, so that the interesting spot in the signal stabilizes and you see it in full size on the small screen. You would need a bit of practice with the specific device, even if you know how to operate oscilloscopes.
As a specialized function plotter the version of Federgraph for iPad does not have any rotary knobs, but will respond somehow to fingers touching the screen. The signals are built in, though these could potentially come from the outside no problem.
When rotary knobs are mentioned in the following paragraphs, please don’t search for them. I just try my best to express things in plain English, which is foreign language enough for me.
Tutorial legend
The legend has been moved out of the way. (Read it only if you are fully awake or need some sleep soon.)
Tutorial steps
- Rotate graph around x and y axis with MouseMove in the center of the screen.
- Rotate around z-axis with horizontal MouseMove over top [TouchBar].
- Zoom in and out with horizontal MouseMove over bottom [TouchBar].
- Navigate to another sample with [S+], [S-], [H+] and [H-].
- Toggle between resolutions [64] and [128].
- Alter the coloring of the graph (texture) with the help of buttons [b+] and [b-].
- Test effect of button [b].
- Try the different color schemes with [c-] and [c+].
- Switch display of text off and on with [txt].
- Use ToolButton and OptionBar on the top.
- Choose parameter [t1], which moves the texture in z-direction.
- Change the parameter with the left [TouchBar] (step width +1/-1).
- Change the parameter with the right [TouchBar] (step width +10/-10).
- Find and watch the textual display for the value of the current parameter while you change it with a [TouchBar].
- Select [t2], the width of the texture, as current parameter and change it.
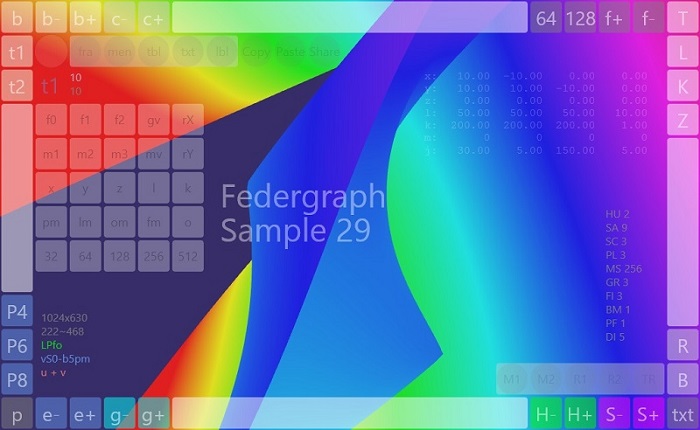
- Navigate to sample 2 (HU=0, SA=2).
- Navigate back to sample 1 (HU=0, SA=1). Note that the resolution falls back to the value of 64. You can select [128] at any time, then the graph may look better, but the calculation will definitely become slower.
- Make plot [P4] the current plot and parameter [L] the current parameter. Change the value of L (all length) with left and right [TouchBar].
- Change other parameters as you like.
- Try out an Animation. Define two sets of state with [M1] and [M2] on the TransitBar first, then start the transition with [TR]. Animations will play a bigger role in a future version, when the remote control feature will be included in the touch screen SKU.
- Point the resolution to [512] before you make a screenshot. To generate a screenshot on iPad press the home button and the sleep/wake button simultaneously. Your screenshot will end up in the camera roll.
- Use [Copy] to save the status of a picture via the clipboard in text format. You could also use [Share] to save the text. It will enable you to recreate the picture later when you put the text into the clipboard again and click [Paste].
Summary
This should be enough for a first step tutorial. You don’t need to know more in order to create colorful images. The explanation of special situations and the use of additional features could fill a blog. I would certainly like to see the images you create and share. There is an almost endless amount of work to do!
As to the underlying physics: You may want to read the old chapter on zentrale Kräftegruppe again.
The sum of all forces is always zero, this is valid also for the sum of component vectors in any given direction.
At the relative low resolution of [64] Federgraph will compute a central force group 64 x 64 = 4096 times and assemble
a picture from the results. This will happen within a few milliseconds
so it may just be meeting click speed operation requirements.
When operated at a resolution of [1024] the whole thing will take a few seconds.
(Try to determine how many central force groups Federgraph will process during this time,
before you go on to save the outcome in the Art folder.)
In terms of math, the equations for the computation of the physical model lead to polynomials. Everything about polynomials should be well known already. But when it comes to the many different images defined by these polynomials, it is quite easy to discover new things no one has seen before. Federgraph has found an interesting spot and will explore it one animation at a time.
Using the Federgraph application, the physical and mathematical aspects are only present in the background, while the artistic aspect, the sculpture work and the coloring, comes to the foreground. Now it gets hard, manual work everywhere, as is appropriate when making real pieces of art. The more skilled you are, the better your chances that your work may be listed high where it matters!
Outlook
Version 1.0 is not the last version of the App. An important addition is the network function which enables remote control.